6 Tips for an Effective Pinterest Ad Strategy
With 431 million monthly users, Pinterest is one of the most popular social platforms on the market. Here’s how to create an effective ad strategy for it.
Read More
With more than 433 million monthly active users, visual discovery engine Pinterest is an oasis for marketers to find new customers, cultivate relationships with existing ones, and sell products or services — especially since the household income of 45% of U.S.-based Pinterest users exceeds $100,000.
But to make the most out of the platform and your ad campaigns, you need to know how to measure your Pinterest ad performance. After all, the more you know what’s working and what’s not with your existing content, the more likely you’ll be able to turn customer connections into serious sales. Leveraging your ad performance helps you create engaging, visual content — paramount to the shopper-heavy Pinterest where 75% of users claim to love shopping and 83% of them make purchases based on brand content.
Ready to get started? Here are six secrets to help measure your Pinterest ad performance.
Before you can effectively measure and report on your Pinterest ad performance, you must first know and understand the platform’s most common terminology:
Followers: the number of Pinterest users who follow your profile
Repins or saves: the number of times users (followers or not) have repinned a pin to a board
Pin clicks: the number of clicks on your pin or ad that take users to a close up of the pin (users remain in Pinterest)
Outbound clicks: the number of clicks on your pin or ad that take users to your website or landing page (users leave Pinterest)
Impressions: the number of times users saw your pin or ad on their feed or search results
Engagements: the number of times users interacted with your pin or ad, including saves, pin clicks, outbound clicks, and carousel card swipes
Daily views: the number of unique users who saw your pin or ad on a given day (as opposed to the total number of times it was seen)
Monthly total audience: the total number of people who have viewed or engaged with your pins in a 30-day period
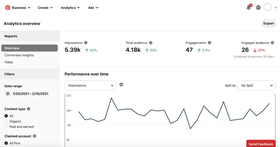
If you’re a Pinterest Business account holder, you’re probably already well-versed in Pinterest Analytics, the free set of tools that helps you monitor key performance metrics and understand your presence and impact on the platform. By showing you what content (both paid and organic) is working on Pinterest — and what’s not — Pinterest Analytics helps you make better business decisions, develop campaigns that support your business goals, target the right audience, and, ultimately, convert more buyers and make more money.
You may be unfamiliar with all the ways you can take advantage of one of Pinterest Analytics’ most resourceful capabilities: a customizable reporting dashboard with a graph displaying your ads’ performance and a reporting table where you can view or export data.
Here’s where to start on customizing your reporting dashboard and analyze telling details of your ad campaign:
Select graph filters, including:
a predefined date range or customized date range within the last 25 months
one or more campaign objectives
one or more campaign statuses (campaign, ad group, or ad level)
a conversion window, date, or source (Pro tip: the longer the window, the better you can measure how your campaigns influence people’s decision-making.)
Create a graph filter to customize how performance is measured, such as selecting a level (campaign, ad group, or ad level), metric (spend or impressions), or comparator (greater than or less than) and value.
Create a table filter to customize which metrics are included in your table.
To start, select existing table filters, including:
Overview — to capture impressions and pin clicks
Delivery — both paid and earned metrics
Performance — Pinterest tag conversion metrics (i.e., when someone takes action on your website after viewing your promoted pin)
Video — video pin views and completion rates
Create a column using formulas to customize how your metrics are calculated and reported in your table.
Select and export your custom data to be downloaded as a CSV file for easy editing and sharing.

A snapshot of the Pinterest Analytics’ customizable reporting dashboard.
While Pinterest Analytics is a great tool to measure your Pinterest ad performance, it’s actually not the only option — or even the best. Reviewers find some of its metrics to be a bit difficult to interpret or even outright delayed by a day or two, which isn’t ideal when you need accurate statistics to prepare a report.
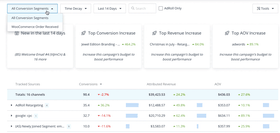
Fortunately, marketing and ads platforms like AdRoll can help you build your brand, better engage with customers, and declutter your data. With AdRoll’s automation builder you not only receive a clear, up-to-date picture of how your campaign is performing on Pinterest but also see how it’s faring across other major social media channels, such as Facebook, TikTok, and Instagram.
As a one-stop shop for your social ad campaigns, AdRoll helps you:
Measure and analyze ads across four major social channels to see a complete picture of how your campaigns are working together.
Find best-fit customers and keep them engaged.
View your data and campaign performance in one powerful, centralized location.
Receive insights on where to make ad campaign improvements and spend your money.
Save time, money, labor, and stress by rolling your multiple ad platforms into a consistent, editable, easy-to-use platform.

By giving you a visual of your campaign efforts, AdRoll’s cross-channel performance dashboard provides optimization suggestions, campaign level data granularity, and much more.
Whether you’re using Pinterest Analytics, a digital marketing platform like AdRoll, or another marketing and reporting tool, you need to know what to look for to best understand your reporting. The more you get your metrics, the better you know how to improve.
In addition to both pin and outbound clicks, here are some of the most important engagement metrics to look for to optimize your Pinterest ad performance:
Average repins, likes, and comments per pin. Looking at how users are engaging with your pins will enable you to think through what’s making them work or fall flat. Are your most popular ads bright and flashy with inspirational messaging? Or are they more subdued in both color and tone?
Follower engagement. This percentage — showing how many followers you can expect to engage with each of your pins and ads — is especially helpful if you A/B test specific campaigns. Testing variables on the same ad week to week (like copy, call-to-action, or visuals) can help you see which ones resonate most with your audience and, hopefully, boost follower engagement.
Reach. Based on unique newsfeed impressions on your pins or repins, this metric tells you how many people are aware of your brand, which is a great start to have when deciding if you need to push more or less brand awareness ads.
Posting frequency. Does your reach or follower engagement greatly fluctuate week to week? It may be your posting frequency, especially if you posted a ton of pins/ads one week and only a few the next. Vary your posting frequency week over week until you find the sweet spot for best engagement stats — perhaps two pins a day is exactly what your customers expect from your brand or maybe they want more and you need to pin six times a day.
Most repinned and clicked pins. While pin and outbound clicks show you how many clicks you received, knowing which pins were most repinned and clicked is critical. Take notes of those pins’ format, style, and messaging and weave them into future ad campaigns.
Top fans and influencers. No matter where you are in your brand journey — whether just starting out or well-established — it’s nice to know you have followers. Influential, well-connected followers, especially, can take your brand to the next level when they repin your content. You also have the opportunity to message them directly to start discussing a possible product promotion partnership. Simply looking at their boards and checking who they follow — and, more importantly, who follows them — can also provide you with audience traits and more pin ideas, inspiring future ad campaigns.
Top converting pins. Are you looking to build brand awareness, boost website conversions, or expand into a new market? Depending on your goals, understanding why certain ads outperformed others can help you optimize future campaigns.
Page visits. A no-brainer. If you don’t know how many times people visited your website after clicking your ad — and which ad drew the most traffic — you’ll be less equipped to turn browsers into buyers.
Add to cart and checkouts. It’s exciting when Pinterest ads result in website visits. What’s less than thrilling are page visits that result in low cart and checkout metrics, which is why measuring page visits, add to cart, and checkouts in tandem is so important. If, say, page visits are high, but add-to-cart rates, you know to focus your efforts on your website.
Though various types of engagement metrics are vital to ensuring ad success, you need to go one step further to create content that will convert: learn the ins and outs of your audience. Where do they live? What are their hobbies? What do they want to buy? What time and days of the week are they on the platform?
The more you know about your target audience — including primary age, language, gender, and interests — the better you’ll be able to sell to them.
You can use Pinterest’s Audience Insights feature to
Learn what current and prospective customers are interested in based on their Pinterest behavior
Measure affinity rate, a percentage of how much a specific audience is interested in a particular topic (such as finance or travel) compared to other Pinterest users. Knowing what topics or products are trending within your target market can help you create campaigns that will speak to them.
Tailor your ads for the devices your audience predominantly uses, whether that’s mobile phones, tablets, or desktop computers.
Understand which ads were particularly engaging during a specific date range.
Now that you know how your ads are performing, you can use these quick tips to optimize your ads and get better results:
When it comes to making standard pins and ads, pick a high-quality, vertical image. Ensure your product image is front and center, and include text overlay to make it stand out.
For video ads, begin with a clear, powerful hook, keep it between 6-15 seconds, and show, don’t tell, with captions and text overlay. Unlike TikTok and Instagram, Pinterest users are less likely to have their sound on, so they’ll miss your message if your video ad relies too heavily on audio.
And for multi-page idea pins, prioritize videos and originality — i.e. not watermarked or repurposed — to truly tell a compelling story. If you work with an influencer, Idea Pins give these creators the chance to showcase their personality and truly engage with an audience.

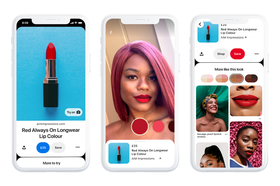
A bright, bold Pinterest ad — like this Try on product pin that allows users to test lip colors on themselves using their phone camera — makes Pinterest users forget they’re viewing an ad.
Now that you know more about your Pinterest, you can start optimizing your Pinterest ad campaigns! Unfortunately, you may feel overwhelmed with information. Don’t know where to start? Take a cue from secret No. 3 and save stress with our marketing and ads platform to create, measure, and analyze your Pinterest ads from one easy-to-use, centralized location. Plus, you can streamline your Facebook, Instagram, and TikTok ads, along with your display ads and email, too. AdRoll simplifies marketing and gives you all the tools you need to have ads that convert.
Last updated on September 10th, 2025.